

I think that all retirement planning, financial independence, financial freedom guides out there all basically hinge on answering this one basic question: how much should you save? It is easy to see this once you note that the amount you do not save can be spent however you want—spending and saving are opposite sides of the same coin.
This post will run through 3 different answers to this question: the 4% rule, 20% of your income, and the lifecycle model. Personally, I prefer the lifecycle model. But you might have different preferences based on your personal values and needs. Here I just aim to present all 3 answers and their rationale to let you decide what works best for you.
Preliminaries
All of the discussion here assumes you already saved (or plan to save) 3-6 months of your monthly expenses for emergency spending. If it makes you feel more secure, you can save more too. This is normally saved into a High Yield Savings Account (HYSA), which is good but not super important. Note that you only get ~$15/month if you are saving only around $10,000 here.
Additional funds you need for short term (<5 years) financial goals can also be kept in a HYSA. I explore some other alternatives for short term goals here.
On that note, the “savings” I talk about in this post is not about saving into short term goals/emergency funds. These savings should not be needed for the foreseeable future, and would have the sole aim to fund future spending. This is money you would save into an investment portfolio that matches your risk-tolerance—I discuss this here.
Throughout this post I will be using TPAW Planner, a fantastic planning tool developed by economist Ben Matthew. The tool itself is incredibly useful, but I also found the learn section great. I highly recommend checking it out.
1: The 4% rule
The 4% rule is often presented as a spending rule, not a saving rule. I don’t think it is a good spending rule, since it is highly vulnerable to sequence of returns risk. I talk about this briefly in the optional section on the downsides of 4% rule here.
But in this post I will ignore the problems it has as a spending rule. This is because it is often used as a way to estimate how much one needs to save for retirement, and with that, has significant impact on people’s saving behavior. Let us first go through what the 4% rule is.
First, it will be helpful to note that this falls under a family of rules we call Safe Withdrawal Rates (SWR). The rule tells us that: for a 30 year retirement period (e.g., 65-95 years old), a retiree with a 50% stock 50% bond investment portfolio can safely withdraw 4% of their portfolio in the first year, and in subsequent years can adjust their withdrawals with inflation. Here is an example, assuming the retiree has $600,000 in his 50/50 portfolio:
| Age | Inflation that year | Yearly withdrawal |
|---|---|---|
| 65 | – | $24,000 |
| 66 | 3% | $24,720 |
| 67 | 2% | $25,214 |
| 68 | 10% | $27,736 |
| … | … | … |
By “safely withdraw” we mean that a retiree has low or no chance of running out of money with this spending strategy. A common misunderstanding is that you will never run out of money following the 4% rule. This is false. If the retirement period is longer than 30 years, it is quite likely that you will run out of money.
SWRs are still useful tools for estimating the amount of money you need to retire. For instance, if you wish to spend $4,000/month in retirement, you can calculate the amount you need to save in the following way:
$4000 x 12 / 0.04 = $1,200,000
This is obviously a lot of money. Retirement can cost a lot more than people expect, and it is often helpful to just know approximately how much you need to save to eliminate the risk of under-saving.
Rationale behind SWR
To be fair to SWRs, this is all that they tell you—you need $X to retire comfortably. But often people take it as a saving goal to hit as early as possible. The reasoning behind it is that once you reach your “nest egg”, i.e. the amount required to fund retirement spending, you no longer need to work for money. You are free to work, or not to work, and you don’t have to do shitty jobs you don’t want to do anymore—the essence of financial freedom.
The type of saving behavior this reasoning leads to, is to aggressively save as much of your income as possible. Every dollar spent is a dollar that could have counted towards your nest egg, and therefore your financial freedom. If you can suck it up and put off on ordering that fancy fruit juice and get coke zero instead, you should. People will often recommend saving 50% or more of your income—the more the better, obviously.
This saving strategy can make sense if the only economically productive thing you can ever see yourself doing is a shitty job that you hate. But if you think that you can secure alternative jobs (even at a lower wage) that you might be happy to do, a more sensible approach might be to build a plan with that alternative income in mind. Recall that as a preliminary, we are already saving up to 6 months of our income, maybe more. This should act as sufficient buffer for you to go out and explore new job opportunities that you might not hate.
Consequence of aggressive savings
By opting for an aggressive saving strategy, the consequence is that you have a lot of money you need to save as soon as possible. The amount you end up having to save also ends up higher, since something closer to 3% is much safer for a retirement longer than 30 years. How many people can reasonably hit a million dollars by 35 or 40 years old? Having this kind of goal also perpetuates a feeling of being left behind. If others are much closer to their nest egg than you are, then you might feel like you need to do more to catch up. The worse cases I see are where people can only start saving when they are 40, and they feel like they have no chance of succeeding because they are “so far behind”.
A different consequence of this strategy is that it results in a spending pattern that is very skewed, which might not be what most people want. By spending pattern i just mean your pattern of spending money to pay for goods (technically it is consumption pattern that matters, but we will skip the nuances here). Here is an illustration:
Suppose you aim to spend $4,000/month during your retirement. Because you are planning to retire early, SWRs are closer to 3%. You will thus need:
$4,000 x 12 / 0.03 = $1,600,000 for your “nest egg”.
Let’s say that you aim to hit this number by 40. If you are 25 now you will have a 15 year horizon to achieve this. Assuming that you have a real return of 6% p.a. from your portfolio (which is already quite a high estimate), you would still need to save ~$5,502/month for 15 years. Even if we assume you are capable of saving that amount, I can’t imagine many would be able to spend more than $2,000/month during this 15 year period. What your spending pattern would look like is thus: $2,000/month from 25-40, and $4,000/month from 40-95. There is a huge spike in your spending from the day before your retirement to the day of retirement itself.

Now in reality, it is unlikely for someone to be in this scenario. I can’t imagine spending jumping by $2,000/month over one day. The more likely scenario may be that you end up spending less than expected in retirement. But the point remains that your spending pattern will be heavily skewed. This will be even more prominent if you end up working in some other job; probably you will end up with more money than you know what to do with. If that’s the case, I also don’t see why there was a need to toil so hard during your younger years.
It is important to note that a skewed spending pattern is not inherently bad. I just want to point out the fact that this is the spending pattern you would be following by using aggressive saving strategies. This may or may not be something you want.
One reason you might not want a skewed spending pattern is because of decreasing marginal utility. Increasing your spending from $1,000 to $2,000 probably increases your happiness by quite a lot. But increasing it from $3,000 to $4,000 will likely increase your happiness by a lot less. So for many people, I think it is quite plausible they would want a smooth spending pattern, i.e. to have the graph flatten out, all else equal (same total amount spent over your life).
Summing up
- SWR/”The 4% rule” can lead to aggressive saving strategies.
- Aggressive saving strategies can make sense if you think you can only be economically productive in a job you hate.
- Setting your “nest egg” as the ultimate financial goal can lead to unhealthy comparisons, or a feeling of being left behind.
- Aggressive saving strategies also lead to highly skewed spending patterns, which may or may not be what you want.
- If you do plan to work some other job, that should factor into your financial plans.
2: Save 20% of your income
This saving strategy is quite self-explanatory. A common recommendation given is the 50/30/20 rule. 50% spending on needs, 30% on wants, 20% on savings. I think this probably works well for many people, especially if they are the type to like to budget. Obviously, 20% is also not a magic number written into the fabric of the universe. You can save more or less than that, as long as you manage to hit your financial goals.
I find that while this is a reasonable saving strategy, its a little too broad. It can be good if you have a very specific goal in mind, like saving for a house down payment, a wedding, or a vacation. But in general, there’s not really an aim behind the saving, and consequently you wouldn’t know how on track you are on savings either.
You could of course aim to hit your “nest egg” by calculating it via the 4% rule. But as discussed in the previous section, this may lead you to push for more aggressive savings over time.
Consequence of 20% income saving
If we map out the spending pattern of this rule, it would look vastly different for people with different income streams. For those earning less when they are young, but with consistent increase in their salary over their lifetime (as with most jobs), the spending pattern will be very step-like. Here is an example:

Each step of the graph would illustrate the effect on your spending pattern when you get a pay raise. For example, when you get a 50% pay raise, you save 50% more and also spend 50% more. So the end result would be a step-like spending pattern.
There is a sharp drop at the end because, if we mechanically follow the 20% rule in this example, you would be able to save ~$1,200,000 into a 100% stock portfolio to fund your retirement at 65. If we take a 4% withdrawal rate, that works out to about $4,000/month in retirement. Note that the spending pattern will actually look a lot smoother if you don’t get as large or as many pay raises. This makes it still a relatively good rule of thumb for most people.
Assumptions for the 1.2 million savings figure

From Portfolio Visualizer. Assumptions:
100% Stock portfolio
Expected nominal return: 7.6%
Volatility: 17.95%
Inflation: 2.4%
Inflation volatility: 2%.
(Basically similar assumptions to TPAW Planner: I also got ~$1,200,000 when I ran it there)
I assumed the savings contributions to be in real dollars, because presumably your wage would also increase with inflation. Each step is thus a “promotion” instead of a standard wage increase.
The potential issue with following the 20% savings rule, is that it both saves too much and too little. It saves too much early on, when your income is low, and saves too little later on, when your income is high. This makes you have to make unnecessarily tight cuts on spending when you are young, but also allow for too liberal spending when you are older,
An underappreciated problem with liberally spending later in life (before retirement) is that you get used to a more lavish lifestyle. This makes the sharp spending cuts you have to take when retiring even more painful.
A good fix for this rule would be something like: save a percentage of your salary increments. Instead of saving a fixed percentage of your salary, by saving the increments you automatically smoothen out your spending pattern. There could still be small improvements in your lifestyle as you get pay raises, but these improvements are more modest, reflecting a more realistic sense of how much you can spend throughout your life (including in retirement).
Summing up
- The 20% savings strategy is reasonable for most people due to its simplicity.
- This strategy can be too broad, as there’s no fixed goal in mind.
- If you expect to get consistent pay raises through your life, this strategy can lead to a step-like spending pattern.
- Step-like spending pattern may lead to over saving when younger and under saving when older.
- Living a lavish lifestyle when older (pre-retirement) can lead to painful cuts in spending during retirement.
- A good fix for this strategy is to save a percentage of your salary increments, instead of your income.
- You can of course save both a percentage of your income, and a percentage of your salary increment. Here’s a start: save 10% of income and 50% of salary increments. Adjust numbers as you like.
3: The lifecycle model
The lifecycle model is a model that tries to approach the question from the direction of spending. What kind of spending pattern are people most happy with? The default assumption is that the smoother the spending pattern the better. At this point it might already be intuitive why. You might not want to have periods where you spend a lot when it is not sustainable. You also might not want to have periods where you spend very little when you don’t have to.
But even supposing that you don’t want a smooth spending pattern, the lifecycle model can accommodate this. If you would rather save more early on because of uncertainty about the future, you can reflect this by tilting the spending graph. Let’s run through an example with TPAW planner.
TPAW planner basics
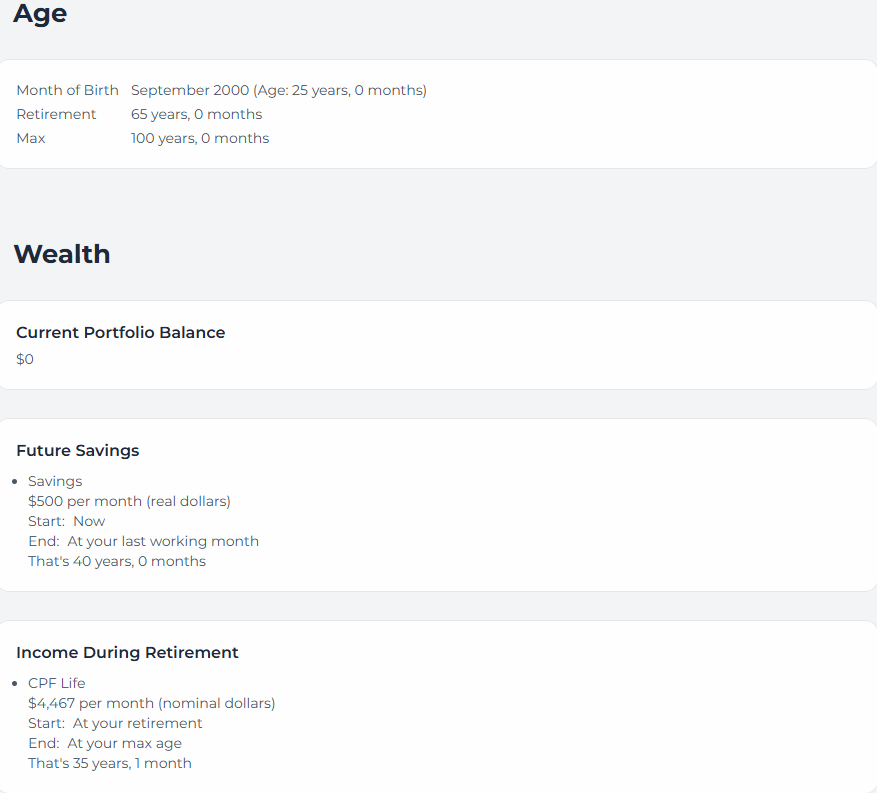
Here I have started out a new plan, with basically just the default settings given by the planner. I keyed in some fairly normal assumptions for age, savings, and CPF payouts, but you can of course use whatever assumptions you are comfortable with. The reason why CPF Life payouts look so high, is because they are in nominal dollars. With 2.4% inflation, that’s what today’s payout (~$1,730 at Full Retirement Sum) will look like in 40 years time. You can calculate this from a basic inflation calculator. Here is the resulting graph you would see:
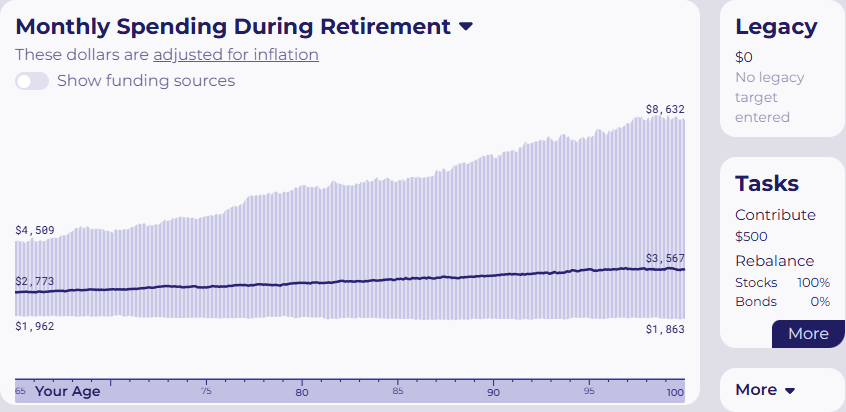
The graph shows your monthly spending during retirement—essentially how much you can spend. The dark blue line shows what your spending will look like in the most likely outcome (50th percentile). The light blue area shows the possible outcomes from the 95th (best outcome) to 5th percentile (worst outcome).
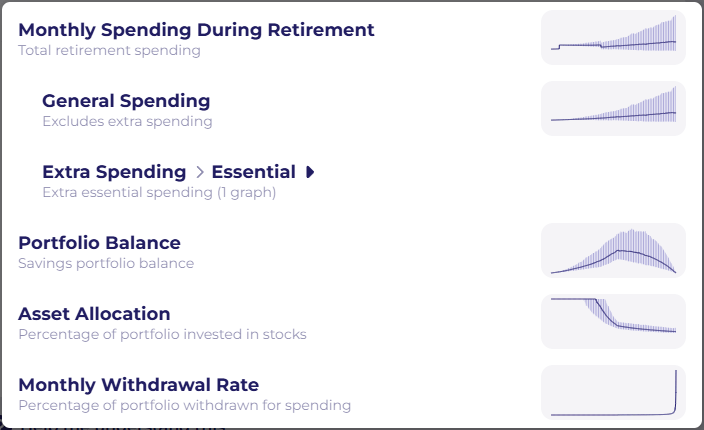
As you can see, in the most likely scenario you are able to spend a comfortable $2,773/month in retirement, which slowly increases throughout. You essentially have no risk of running out of money. Even in the 5th percentile, you will still have $1,962/month to spend and this stays relatively flat throughout. This plan of course would assume that you hit the CPF Full Retirement Sum (FRS), if you are unable to you should readjust the assumptions. Now if you click the dropdown bar beside Monthly Spending During Retirement, you can see a few other graphs:
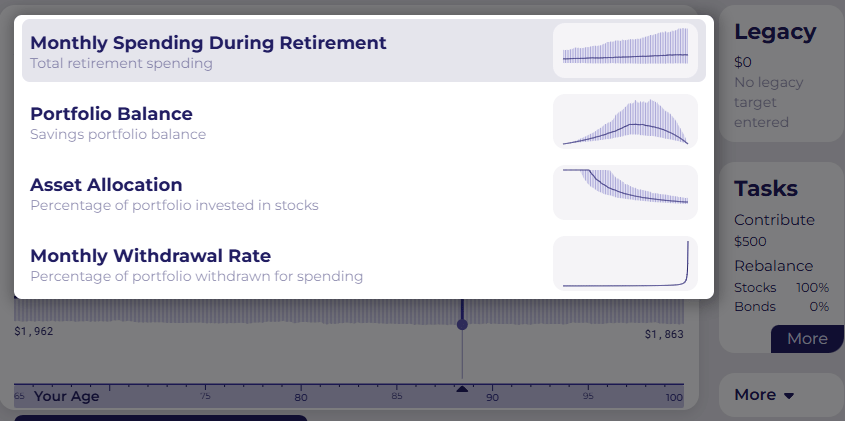
Portfolio Balance is quite self-explanatory, if you looked at it you would realize that you only accumulated ~$500,000 at 65 but still would be able to fund a stable retirement.
If you click on Asset Allocation, you would see that it actually recommends you to go for a 100% stock portfolio when you are young, while slowly allocating more to bonds when you are old.
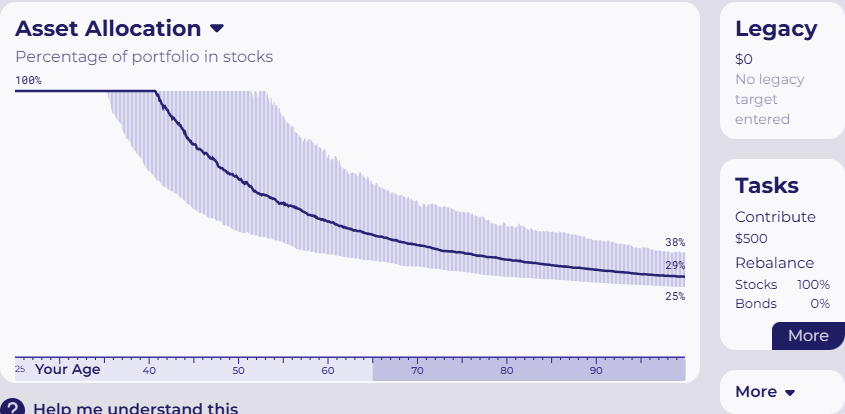
This is a formalized version of the colloquial advice to have “110 – your age” in stocks. If you have heard of Target Date Funds before, they are essentially funds that do this reallocation for you. Unfortunately, these funds have some issues at the fund management level, and there are also not many Ireland-domiciled funds easily available.
I encourage you to play around with the planner. I would not modify things in the Advanced section, especially the expected returns. It is often better to plan with conservative returns compared to extravagant ones, especially with unrealistic expectation of returns in today’s markets. One thing you should play around with is the Risk section. The default is a moderate risk level, which gives you the asset allocation above. If you are more conservative, the planner gives you a smaller stock allocation. And if you are more aggressive, the planner gives you a larger stock allocation.
You should also play around with the Spending Tilt, which basically just tilts the monthly spending graph upwards or downwards. This lets you register how much spending cut you are willing to take today, for more certainty in spending in the future, and vice-versa. It is actually more typical for retirees to spend less later in life, due to mobility difficulties and also a losing interest in travelling.
The best way to use this planner is to constantly update new events that happen in your life. If you got a pay raise and would like to save more, increase the savings. If you can’t save for a period of time because you have to save for a house down payment, take out the savings for that period.
More advanced usage
The basic usage of the TPAW planner doesn’t really differentiate much from the 2 other strategies we explored so far. At this point it essentially functions like a spending planner, giving you a concrete recommendation on spending instead of a fixed SWR, like 4%. This is already very useful, since it helps retirees manage the spending from the portfolio they have. If the market is not doing well, the planner tells them they have to cut back on spending or they risk running out of money. How much they should cut is quite a different problem. I might do a write-up on that in the future.
In my opinion the best way to use TPAW planner, is to utilize its full capacity for life cycle planning. This can actually be done quite simply:
- First, in the Age section we change our status to retired. You will see an alert telling you that the Future Savings section is no longer applicable, as well as changes to income during retirement. Just click Apply Changes for now.
- Next, we change our Income During Retirement from CPF Life from Start: Now to Start: When you are 65 years (or whenever you plan to withdraw).
- Finally, we just add in your monthly income into Income During Retirement. Remember to set it to End: When you are 65 years (or whenever you plan to retire). I will use $3,000/month real income in this example.
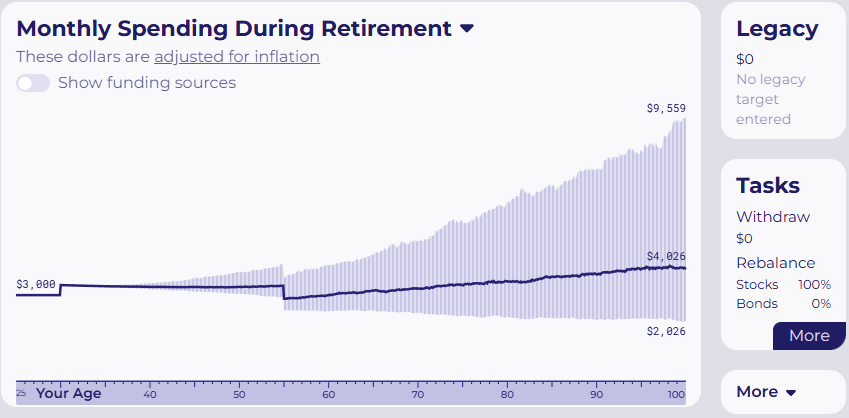
The resulting graph will look like this:

Notice that now your age does not start at 65, but at 25 instead. Amazingly, the planner also automatically tells you how much you should contribute to the portfolio today! It does all the planning for you, and answers our original question: how much should you save? The answer, in this example is $747 out of your $3,000 salary. The rest, you can spend however you want.
Planning in future promotion and mortgage
Note that the planner is only as good as the information you provide it. For example, if I foresee a promotion in 5 years time, I should include that into the planner. In this case, I will just add in another $1,000 into Income During Retirement, starting from 30 years and ending at 65 years:

As you can see, the planner tells me that I can contribute less, in this case $214 out of my current $3,000 salary. This is because some of my future saving is taken care of by the pay raise from my $1,000 promotion when I am 30 years old.
I can also add in essential spending. For example, I might get my BTO when I am 30, and would have to start paying mortgage payments. Let’s assume this mortgage payment is $1,000/month for a 25 year period:
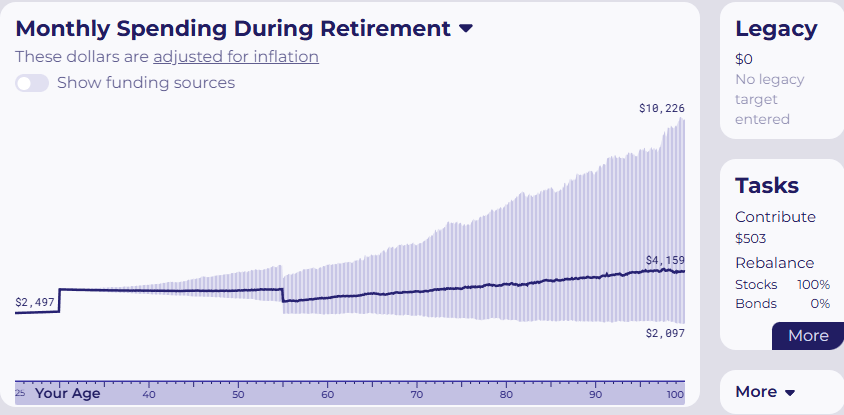
We now see a bump in spending during the period of mortgage payments. It also tells us to up our savings again (to $503) because we can now save less of our future promotion money. The graph looks uneven here, but this is only because we are looking at all spending, including mortgage payments. We can exclude the essential spending through the dropdown menu:
If we click on General Spending, we see that our spending graph is relatively smooth again. This makes sense, since we don’t really get to “spend” the money we use to pay for mortgage payments. What we want to smooth out is the money we are somewhat free to use.
Since you have added your mortgage repayments, you might also want to add in your down payment. Putting in a lump sum Essential Expense at the time you need to pay your down payment is not recommended. This is because the planner will basically recommend you to put your money in stocks, which you don’t want to do if your down payment is in less than 5 years. Instead, you should make a monthly saving plan and key that into the planner as a monthly Essential Expense. For example, I might make a plan to save $50,000 in 5 years in a 2% yield HYSA. You can either use a savings goal calculator, or the PMT function on excel to do this. In this example that comes out to ~$800/month starting today. Let’s add that into our planner:
The planner now tells us not to save any money (into the portfolio). This is because our $800/month saving is now an essential expense. If we look again at the General spending graph, it will tell us to only spend $2,200/month.
That should be all you need to know to fully utilize the planner. Play around with the different commands and have fun with it! Your portfolio will be updated live based on global stock market data. Unfortunately, the inflation rate is based on US data, and you would have to adjust it manually (as well as the expected real returns), if you have different assumptions for Singapore. This shouldn’t be a big issue since it still gives a broad outline of how much is recommended to save/spend.
The website is also currently undergoing development. At this stage you cannot add in your own Asset Allocation, unless you go under the Advanced section and change your strategy. The only other way is to try to adjust it through how conservative you are under Risk. Unfortunately, it will almost always allocate you 100% stocks when you are young. This is simply because that is the optimal allocation if you are planning to hold stocks at all: Basically, the idea is that if you are going to hold stocks later in the future anyway, holding all of them as early as possible, lets you hold these stocks for longer (time diversification). This does not mean stocks are not risky when you hold them longer, it just means you decrease your reliance on stocks having to do well when you need to withdraw from it. But of course, you might not want to have a 100% stock portfolio for all kinds of reasons. And you shouldn’t, if you are not comfortable with it.
Summing up
- The lifecycle model is a useful tool for planning both spending and saving. It aims to smooth spending across your lifetime.
- TPAW planner incorporates the lifecycle model into an interactive website.
- The planner is only as good as the information you provide it. But when it works well (in the Full lifecycle application), it can tell you exactly how much you should save and how much you are free to spend.
- The best way to use the planner is to regularly update it with new information. If you expect a promotion, add that information in.
- In the Full lifecycle application, you can also plan for early retirement or a less stressful and lower paying job.
- Early retirement can be set by just setting the End date of your salary earlier.
- A lower paying job (perhaps during “early retirement”) can be set by adding a new income stream after your original income stream ends.
Personally, I answer the how much should you save? question by using TPAW planner. I do think that even if you don’t want to utilize the Full lifecycle application of the planner, it can still be very useful to use it to see where you are at with your savings. In any case I hope you found it useful to see the different saving strategies, with their rationale and potential downsides.
Read next: Investing for beginners
